Welcome to My Portfolio
Overview
I'm Emilio Nahuel Pattini, a Data Analyst and Web Developer passionate about transforming complex data into clear, actionable insights and building modern, responsive web applications.
My work combines strong technical skills in R, SQL, Python, machine learning, and clustering with practical storytelling. Recent highlights include the Diabetes Risk Analysis & Public Health Insights project (end-to-end analysis with heavy SQL, clustering, predictive modeling, and an interactive Streamlit dashboard) and the Olist Brazilian E-Commerce Analysis (RFM segmentation, cohort analysis, forecasting, and Power BI dashboard).
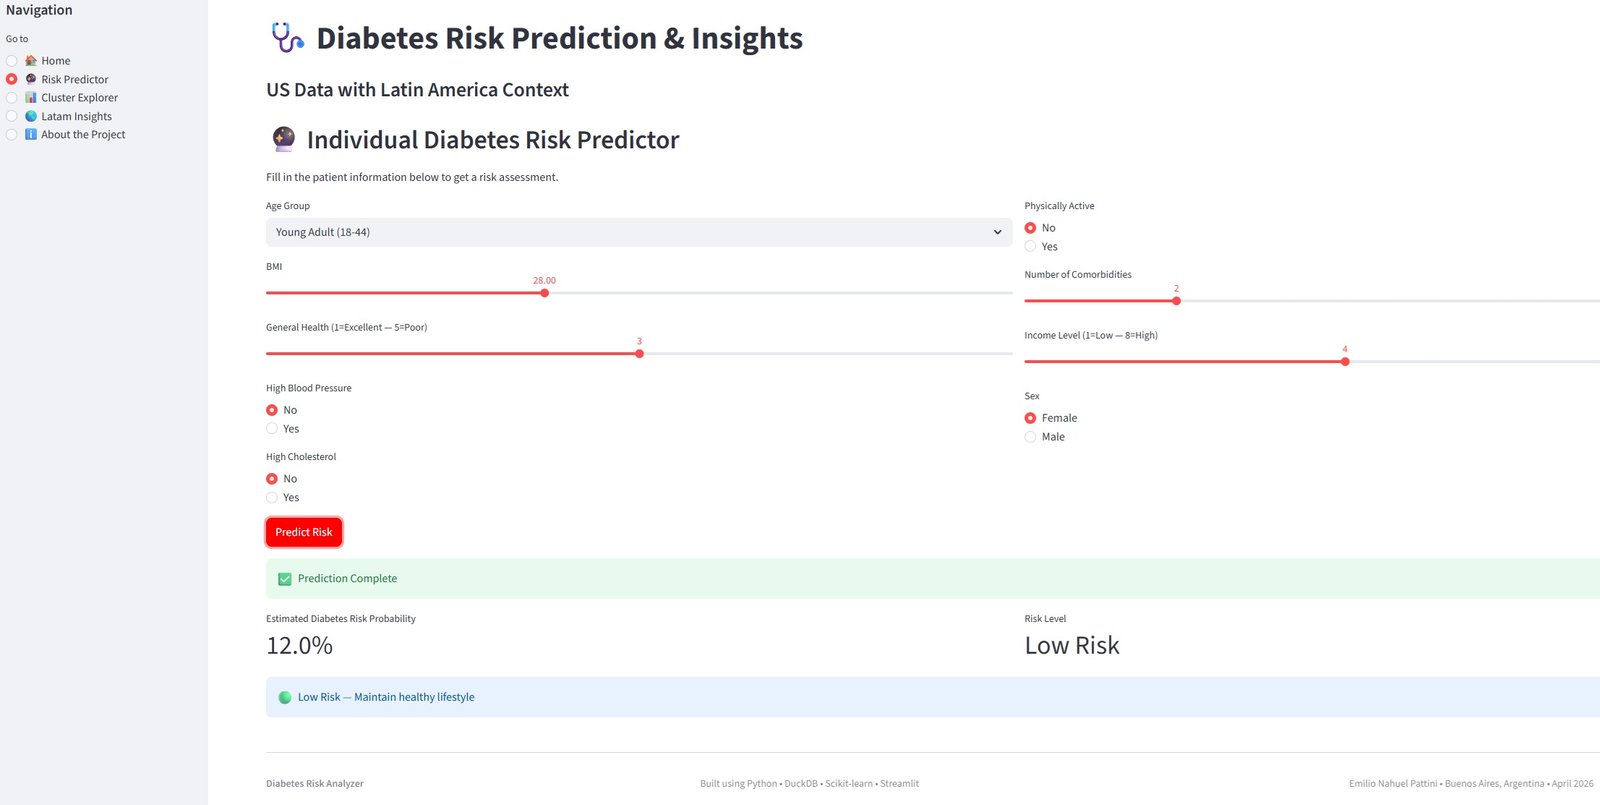
Diabetes Risk Analysis & Public Health Insights
End-to-end project with heavy SQL (DuckDB), feature engineering, binary classification, K-Means clustering,
and a fully interactive Streamlit dashboard. Includes Latin America context and 2050 projections.
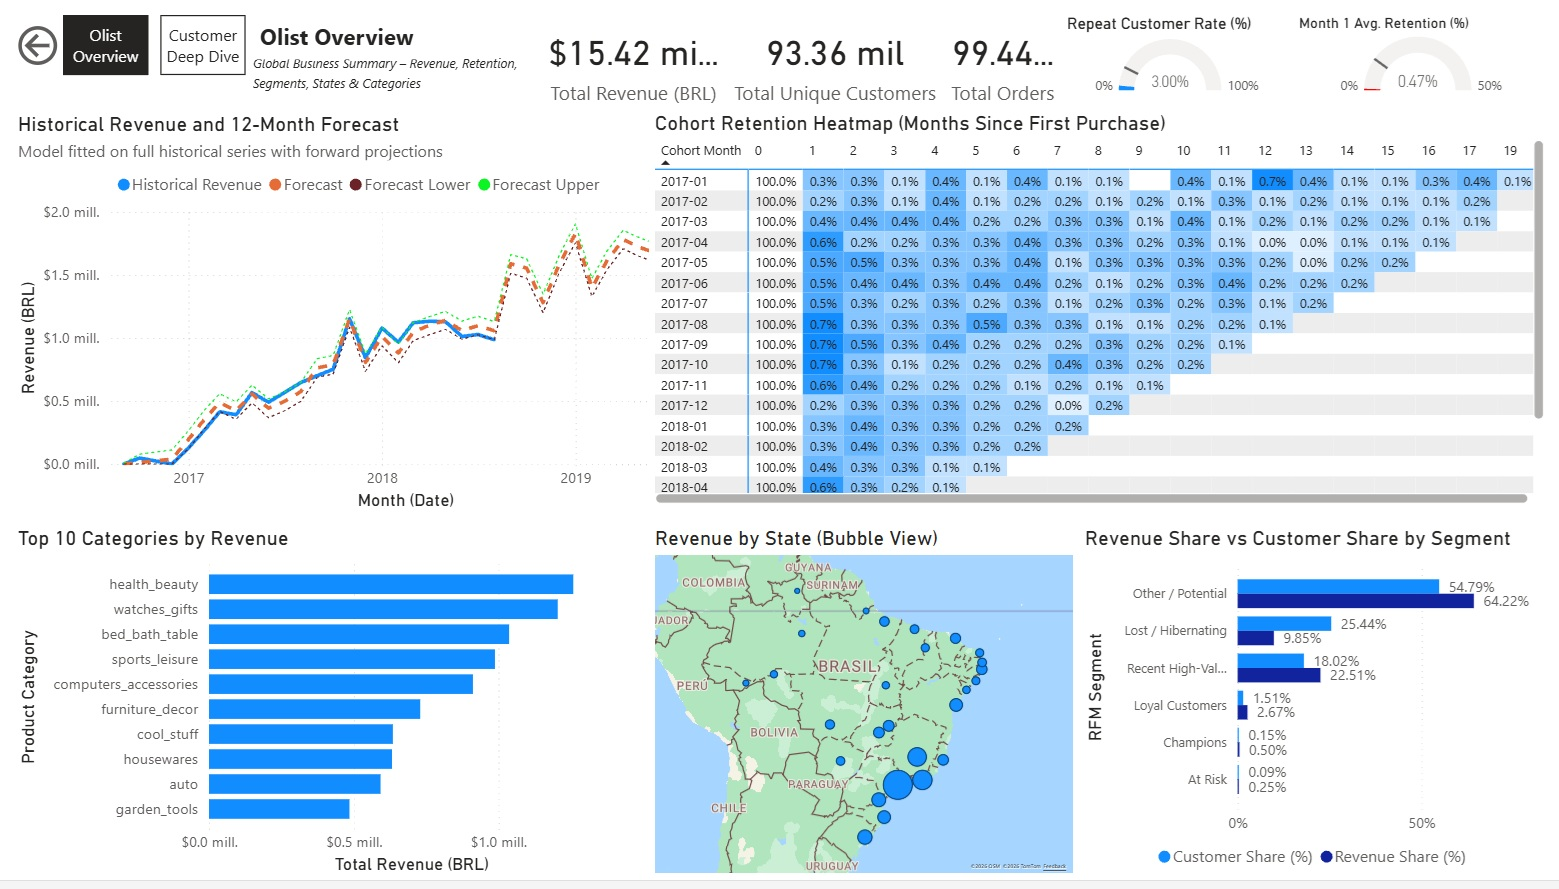
Olist Brazilian E-Commerce Analysis: RFM segmentation, cohort retention, Prophet forecasting, and interactive Power BI dashboard with actionable business insights.
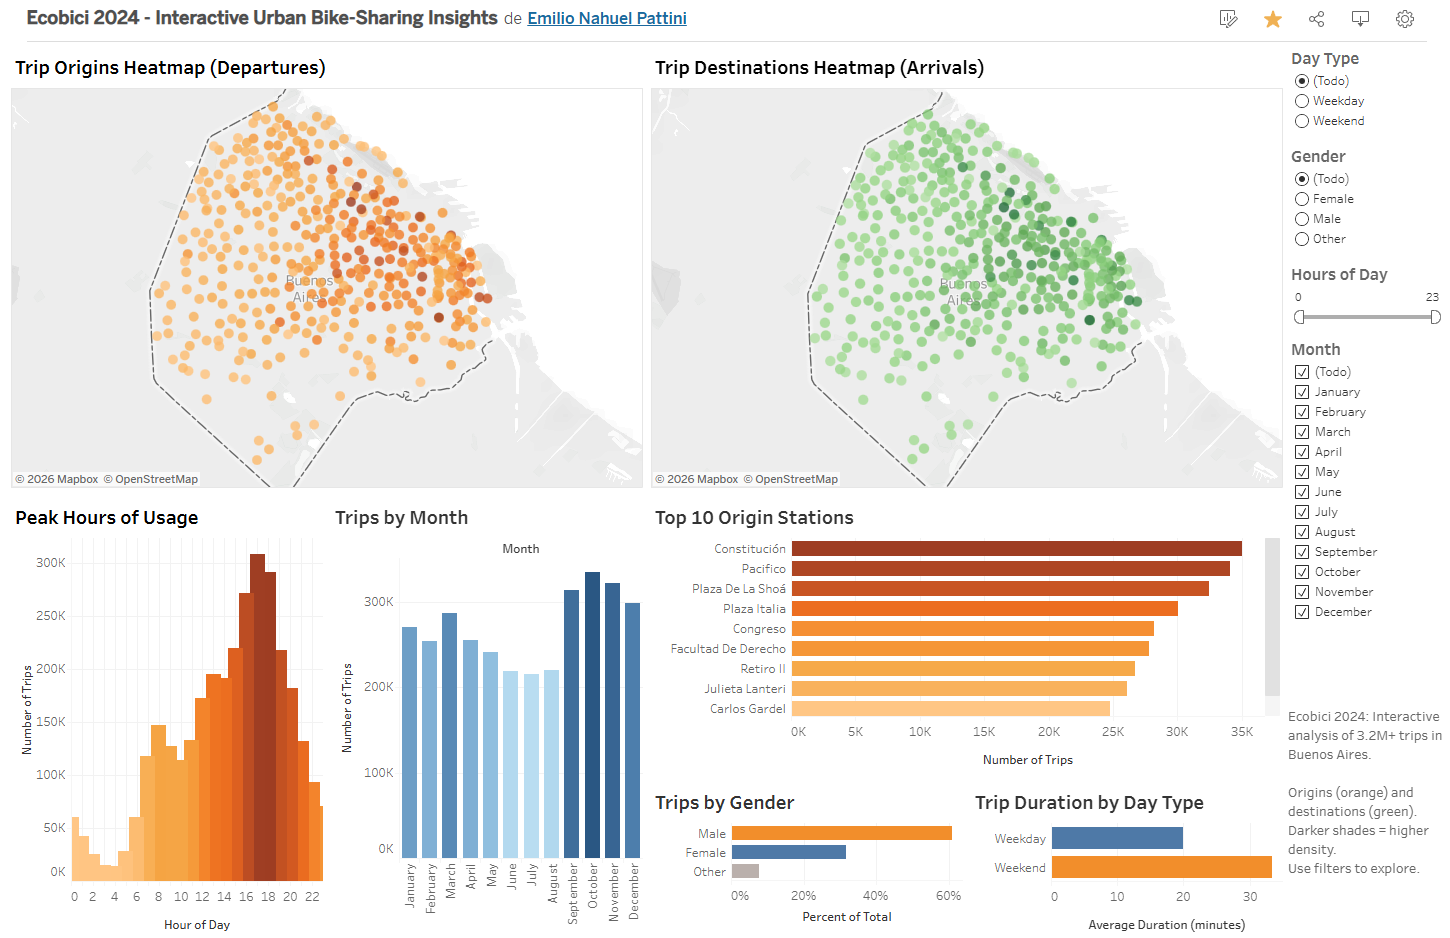
Ecobici 2024: Urban Mobility Analysis focusing on bike-sharing usage patterns and station performance.
Personal Portfolio Website: Responsive design, interactive components, and polished branding.
Skills & Tools
- Core Technologies: Python (pandas, scikit-learn, numpy, seaborn, plotly, prophet), SQL (DuckDB, MySQL, PostgreSQL, DB2), R (tidyverse, lubridate, leaflet)
- Data Engineering: Advanced data cleaning, feature engineering, reproducible workflows (Jupyter, RMarkdown)
- Analysis & Modeling: Exploratory Data Analysis (temporal, spatial, demographic, RFM cohorts), Binary Classification, K-Means Clustering, Risk Scoring, Cohort Analysis, Forecasting & Time Series (Prophet for revenue prediction, seasonality detection, growth scenarios), Statistical Methods
- Customer & Business Segmentation: RFM scoring, segment visualization, actionable recommendations (retention, upselling, win-back)
- Visualization & Dashboards: Streamlit, Power BI, Tableau, Plotly, Matplotlib, Seaborn, R Markdown
- Web Development: HTML5, CSS3, JavaScript (interactive components, responsive design), WordPress, multilingual content (EN/ES/IT)
- Workflow & Communication: Business storytelling, actionable recommendations, reproducible reporting, collaborative presentation
- Domain Knowledge: Public Health, Customer Behavior, Urban Mobility
- Languages: Spanish (Native), English (Fluent), Italian (Intermediate), Portuguese (Basic)
Featured Projects
Diabetes Risk Analysis & Public Health Insights
Comprehensive end-to-end project using BRFSS 2023 data. Heavy emphasis on SQL with DuckDB, feature engineering, binary classification modeling, population segmentation through clustering, and a professional interactive Streamlit dashboard. Includes Latin America trends and 2050 projections.
View Online | GitHub RepoOlist Brazilian E-Commerce Analysis
Full end-to-end analysis: RFM segmentation, cohort retention, revenue forecasting with Prophet, interactive Power BI dashboard. Key result: identified 97% one-time buyers and massive retention opportunity.
View Online | GitHub RepoEcobici 2024 Urban Mobility Analysis
An in-depth analysis of urban bike-sharing data to understand usage patterns, peak times, and station performance. This project involved cleaning large datasets, performing exploratory analysis, and visualizing key trends to inform urban planning decisions.
View Online | GitHub RepoInteractive Power BI Dashboard
Full interactive dashboard with global KPIs, revenue forecast, cohort heatmap, RFM segment comparison, state-level revenue map, and top categories. Filter by state, category, or segment to explore insights dynamically.